
Remdash: Custom Data & Dashboards
Here’s How Delta Pronatura Saves More than 600 Hours of Work Every Year with Remdash’s Custom Dashboards Feature.

20+ Dashboards, 300+ Widgets, one Tool.
Here’s how Delta Pronatura uses Remdash’s custom data and dashboard features to stay on top of 4 European Amazon markets and save more than 600 hours of work per year.
Über

The Challenge: No Overview of the Performance of the Product Portfolio
Lack of a Performance Overview for the Product Portfolio
Brand manufacturers like Delta Pronatura, who sell different brands across several Amazon marketplaces, are often confronted with one crucial challenge: How to keep track of these numerous different products and their performance. Especially in a dynamic e-commerce environment, a top-down overview is essential: If the performance of a product or group of products drops, it is important to identify the cause as quickly as possible in order to be able to take the appropriate course of action.
Time-consuming, Manual, and Error-prone Excel Operations
Theoretically, the performance of a given product portfolio for each Amazon market can be viewed inside Amazon Vendor and Seller Central. However, three notable aspects, in particular, prevent this method from providing a holistic and quick overview:
- Important Data Points are Lacking
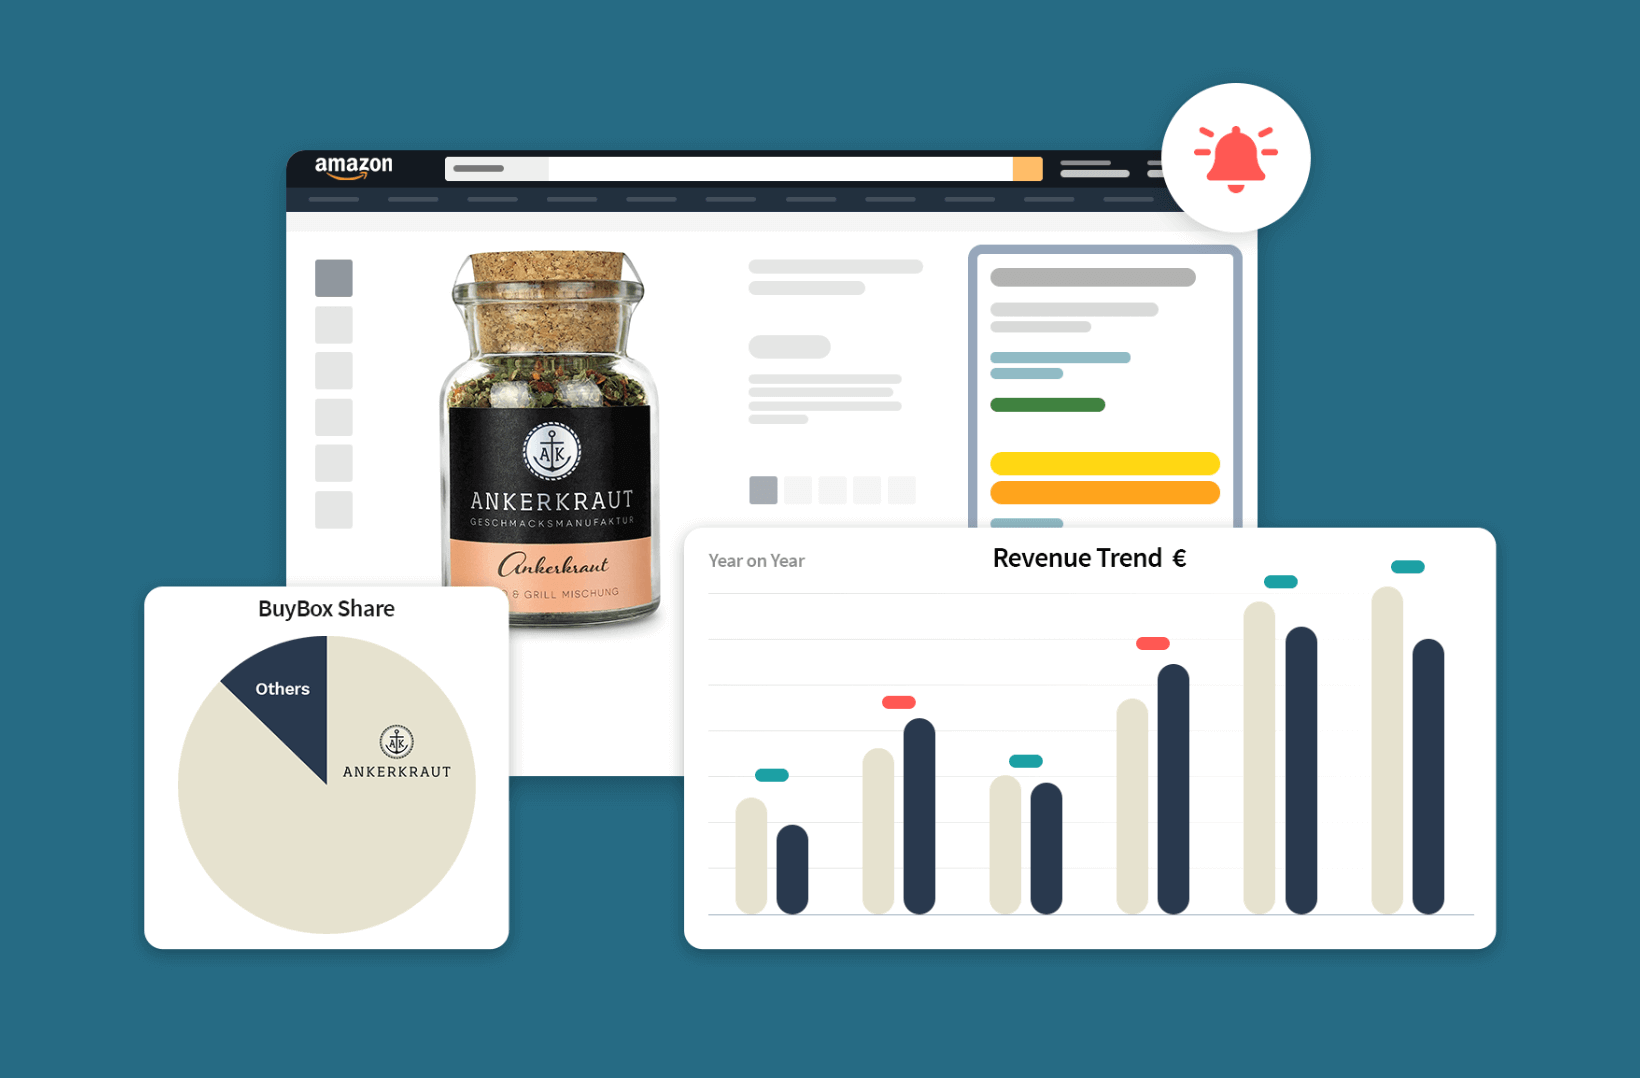
Numerous core Amazon-relevent KPIs such as the content comparison from the target vs. actual state on Amazon, BuyBox ownership, and Share of Voice are not displayed in Amazon Vendor and Seller Central. - No Visualisation and Rigid Data Structures
Raw data is rarely visualised and when it is, the presentation is often predefined and cannot be adjusted. KPIs are therefore often not visible at first glance and it requires manual effort to integrate them alongside the performance data. - Only the Entire Product Portfolio Is Visible
With Amazon’s tools, the performance of the product portfolio in its entirety is all that can be evaluated. Specific product groups (such as a breakdown via brands, select bestsellers, new launches, etc.) that can drive performance up or down are not displayed.
The result: All of these shortcomings lead many e-commerce managers to export Amazon data into Excel sheets and spend many hours manually compiling and comparing data from various sources. This leads to the following pain points, among others:
- Inconsistent Exports
Exports often have a level of inconsistency due to external factors such as the recent change in Amazon reporting (from Amazon Brand Analytics to Retail Analytics). - Error-Prone Excel Lists
Due to the manual creation and maintenance of Excel lists, errors and duplicates can creep in quickly and go unnoticed. - Daily Export Necessary
The data bandwidth in Amazon systems is not very flexible, making exporting large amounts of data a slow process. In order to be able to work with up-to-date data, e-commerce managers need to download an export at least once a day.

We used to have to spend several hours collecting data from Excel lists to keep track of the performance of our products on Amazon. Making data-based decisions this way was very tedious, time-consuming, and sometimes frustrating for us.
Sandra Vrdoljak
E-Commerce Manager, Delta Pronatura

The Solution: Remdash’s “Custom Data & Dashboards” Feature
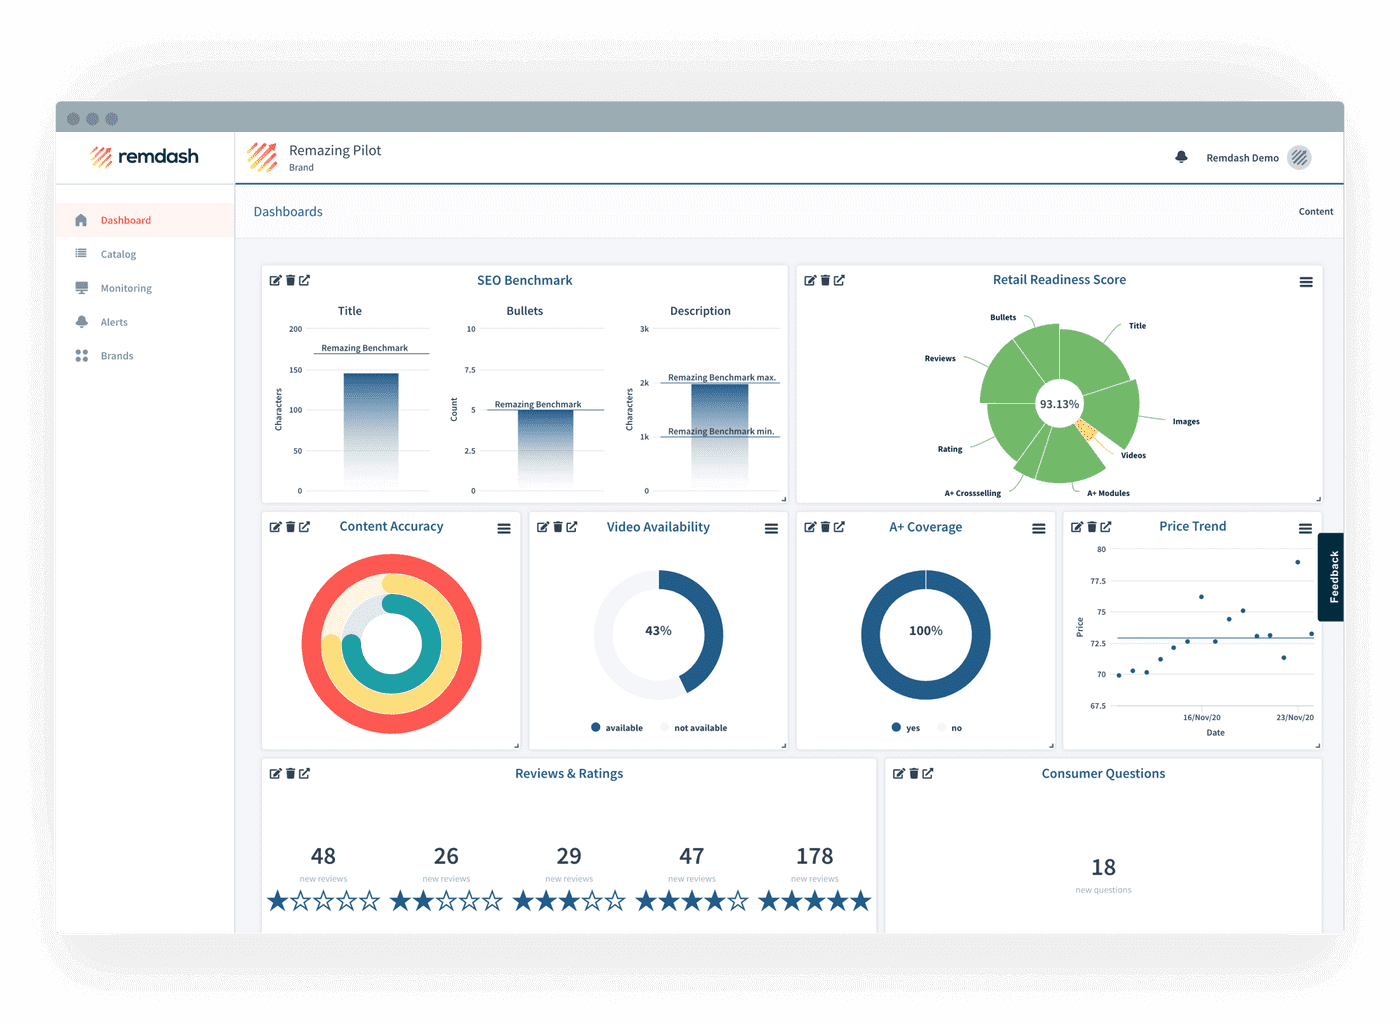
In order to get the desired overview and to make better decisions, Delta Pronatura makes use of Remdash’s “Custom Data and Dashboards” feature. Sandra and her team use Remdash daily for their whole product portfolio. The visualisations on the dashboards enable them to make and implement decisions much faster.
Cluster Portfolios into Different Product Groups
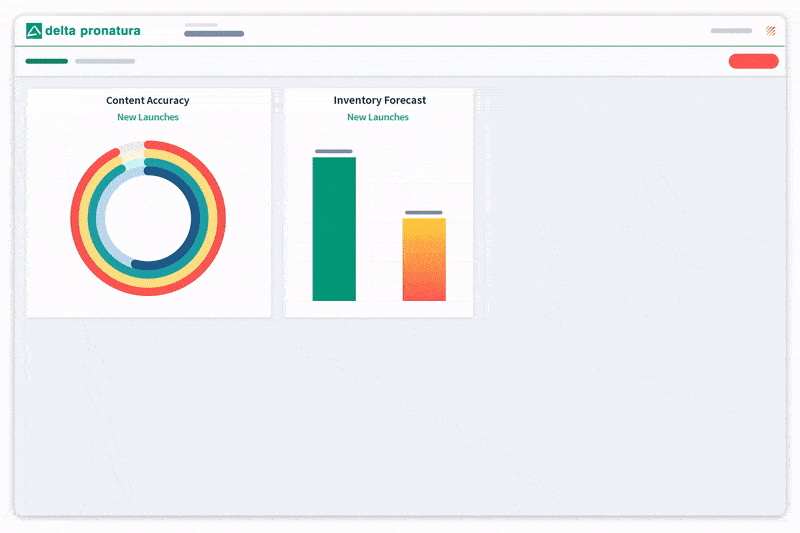
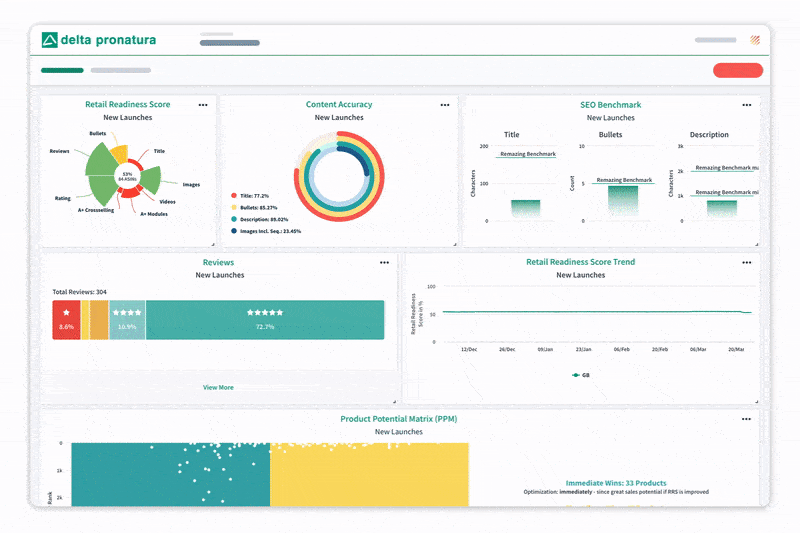
With Remdash, e-commerce managers can easily cluster their product portfolio into groups and view data about these groups on an individual basis. Whether for subbrands, bestsellers, new launches, or a specific series – the criteria for creating groups can be freely selected according to need. In addition, any number of product groups can be created to help visualise the relevant KPIs.
Snapshot Overview via Visualisation
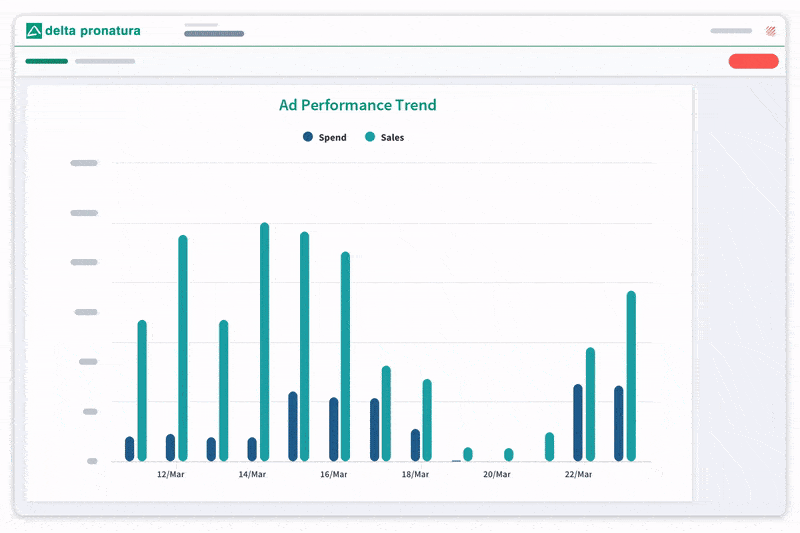
A dashboard makes it possible to bundle and visualise all Amazon data from Vendor Central, Seller Central, and Amazon’s Advertising Console in one place. In addition to sales development, ACoS and conversion rate, e-commerce managers can display additional KPIs in Remdash that are not available via Amazon. These include content matching, BuyBox share, and information on whether certain ASINs have Amazon badges/awards. In addition, widgets can be created with Remdash that combine several data points over a pre-determined period of time which helps indicate correlations.
Dashboards Can Be Easily Shared across the Team
Instead of sharing manually created Excel spreadsheets repeatedly in the team, the dashboard just needs to be shared with everyone, once. This way, every team member is always up to date.
Our team uses a number of dashboards that are also shared within the company. For example, with Mirko, our Head of E-Commerce, with whom we can look at important figures at the top level, including the development of the inventory forecast over time.
Sandra Vrdoljak
E-Commerce Manager, Delta Pronatura
The Result: A Successful Overview and Automated Work Processes
Thanks to Remdash, Delta Pronatura can automate numerous manual work processes. It is estimated that this saves their e-commerce team over 600 hours of work per year. With the help of over 20 dashboards and 300+ widgets, Sandra and Mirko’s team can keep track of all brands and products, allowing them to focus more on the key, strategic e-commerce issues.

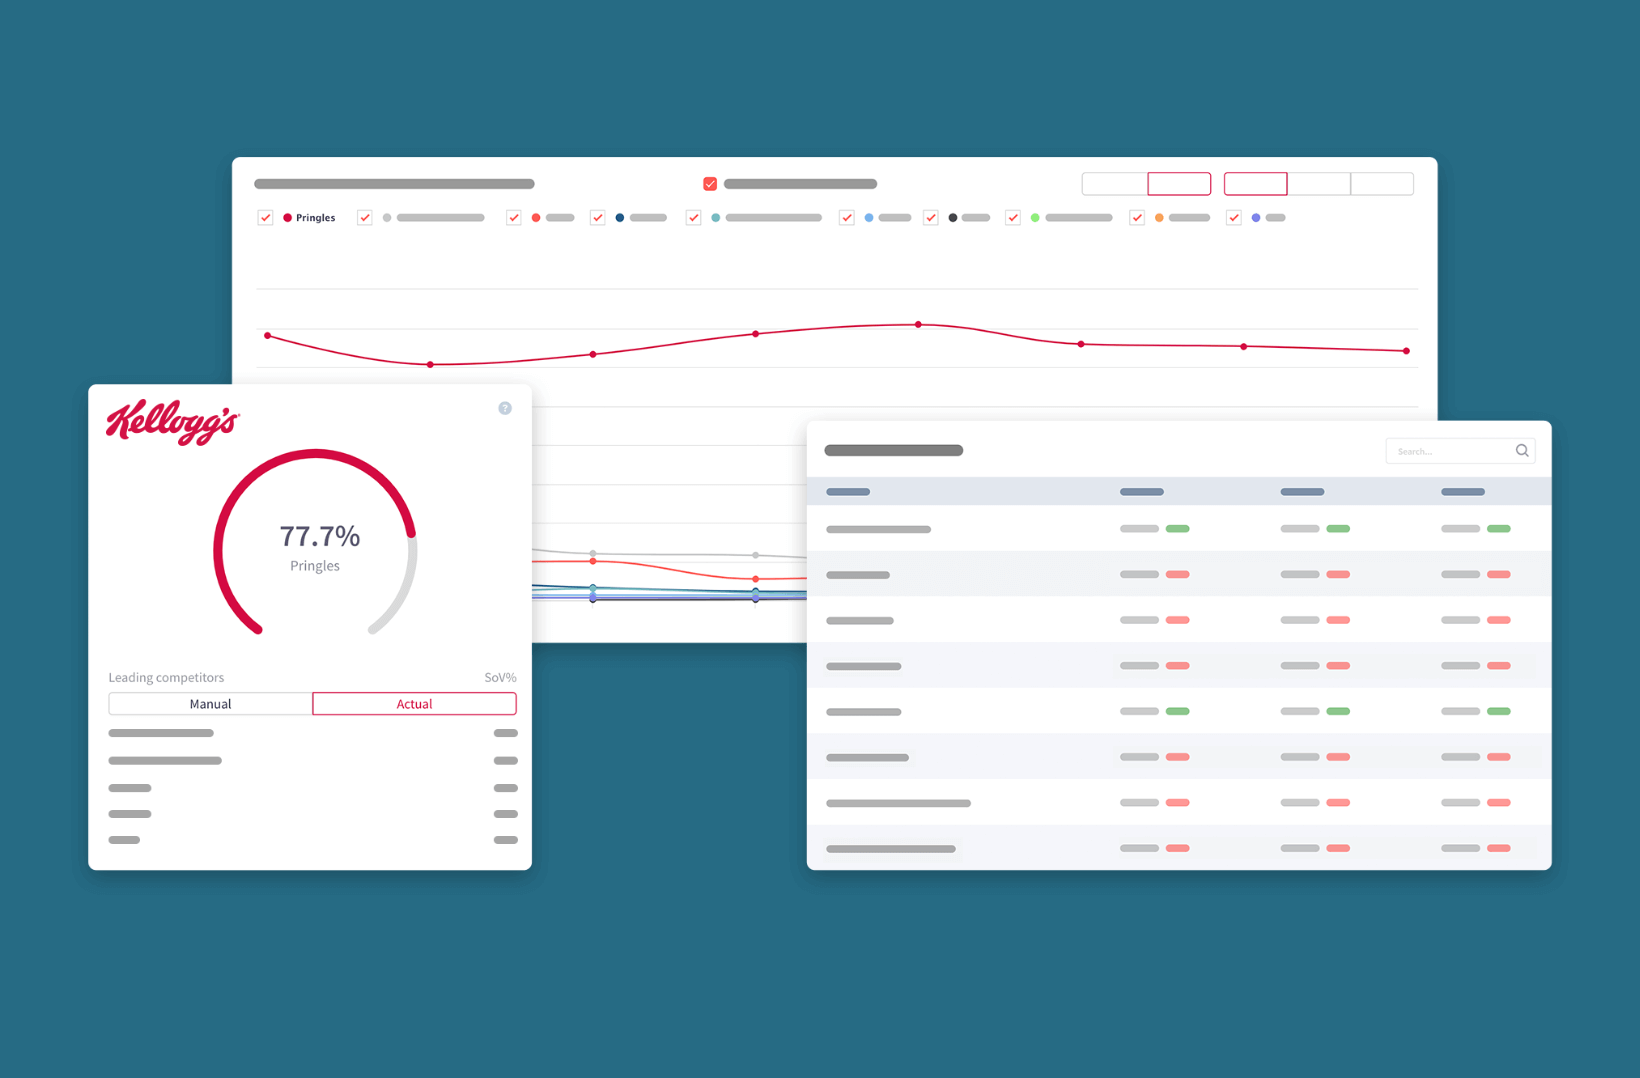
Remdash visualises data via dashboards better than any other tool. I can gauge current performance at a glance.
Sandra Vrdoljak
E-Commerce Manager, Delta Pronatura
Remdash has had an immediate effect on our business and has saved us a great deal of time. The setup was super quick, our only regret was not adopting it sooner!
Mirko Messerschmidt
Head of E-Commerce, Delta Pronatura

Share this article
Related articles

Remazing GmbH
Brandstwiete 1
20457 Hamburg
©Remazing GmbH