

Amazon Category Insights: A rare insight into your own market share

Keeping track of the Amazon jungle is often a challenge. Especially as Amazon rarely provides in-depth insights.

Data provided by Amazon itself
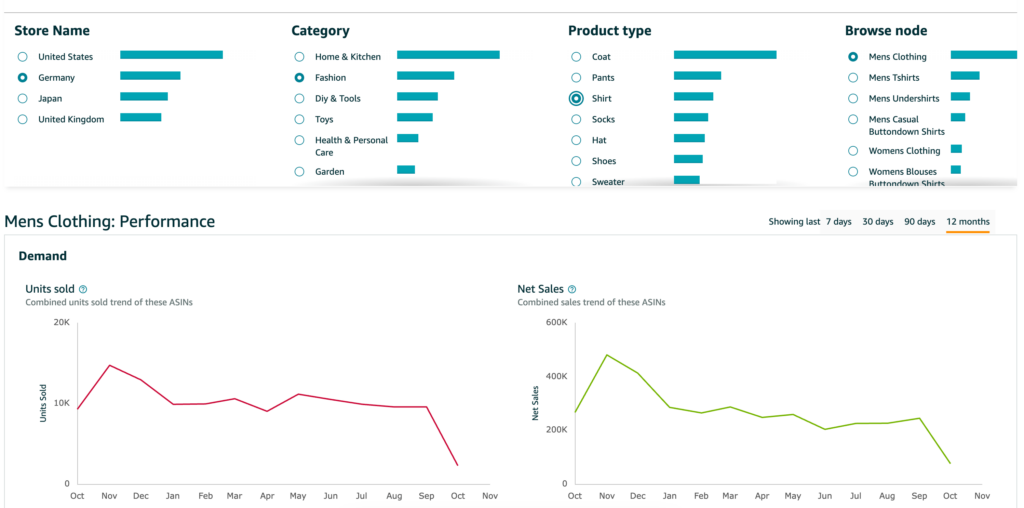
Amazon, notoriously reluctant to share data, has recently made it possible to access and analyse far more comprehensive market data. Divided into Amazon-specific sub-categories, so-called browse nodes, it is now possible to retrieve, among other things, units sold and net sales, as well as the accumulated page views of all ASINs in the Amazon category. This makes it easier to calculate market shares. By analysing this historical data (across a period of up to 12 months), companies can identify growth trends in different categories. This is particularly useful for analysing growth potential and developing market strategies.
Practical use cases
Calculate market share on Amazon
Your own sales turnover is compared with the total sales of all products in a given browse node to determine the market share.
Market entry analysis for Amazon
Insights into specific browse nodes can be used to identify the fastest-growing categories. This helps to identify markets with high growth potential for possible market entry. However, it is not always possible to recognise how strongly a market is segmented.

Subscribe to our newsletter now and receive regular updates on Amazon and other online marketplaces.
Subscribe to the newsletter now.
Identifying niches
The tool also makes it possible to identify potential niches for product placements.
Restrictions and challenges
However, there are also some challenges: The data available is limited to the USA, UK, Japan, and Germany. Additionally, the browse node naming convention is not adapted to the language of the marketplace and is therefore only available in English, which means that some browse node names cannot be translated one-to-one. There is also no export function. Finally, some monthly data has shown to be unreliable or even missing completely, especially for the last completed month.
The data is separated strictly according to the smallest possible Amazon categorisation and only one browse node can be displayed in the tool at a time. This means that larger market trends can sometimes only be analysed by independently pulling together and accumulating the data from the relevant browse node. At the same time, some browse nodes are vaguely defined in comparison. This makes it difficult for Amazon to assess whether the developments and trends displayed are also relevant for their own products.
The reliability of the data should generally be questioned: an initial review shows that only a handful of browse node categories achieved higher growth or higher results last year than this year, which indicates possible inaccuracies. In addition, some brands strategically place their products in unrelated or less popular categories, which can distort the results and data analyses.
Conclusion
Amazon’s Category Insights offer valuable insights into the complex market dynamics and market share, but are not without their flaws. Carefully analysing this data in combination with your own sales figures gives companies a clearer picture of their market position and opportunities in the Amazon Marketplace. However, this data should always be viewed critically, as not all information appears to be complete and accurate.
Are you interested in an expert analysis of your Amazon account?
Request free analysisShare this article
Related articles

Remazing GmbH
Brandstwiete 1
20457 Hamburg
©Remazing GmbH
